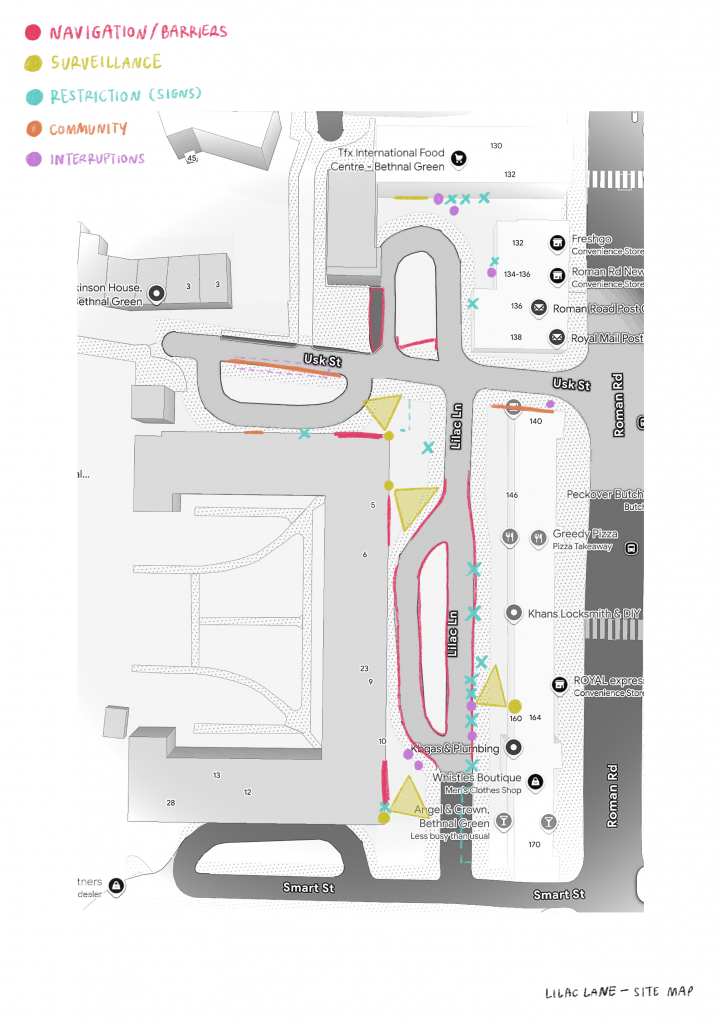
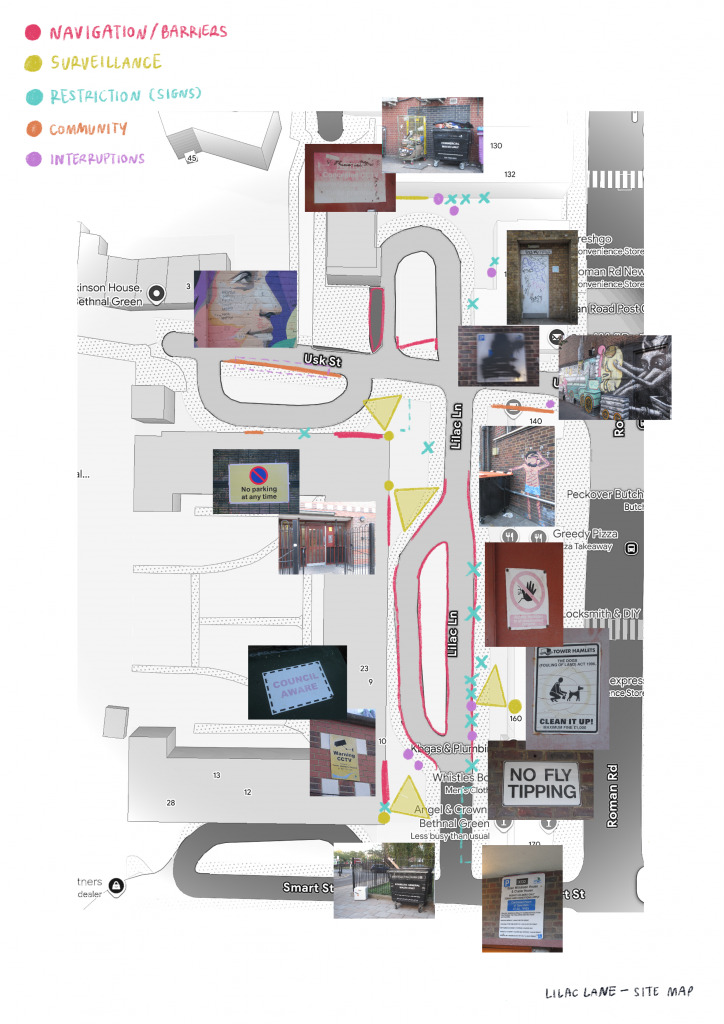
Where do the estate’s systems of control overlap, and where does human behaviour disrupt them?I returned to my quick map sketch and developed it into a more detailed map using a Google Maps view as the base. I annotated the estate with different layers of control: navigation, surveillance, restriction, community and interruption. I colour-coordinated the annotations so that the different systems could be read separately and in combination, then placed my photographs over the map to connect the mapped observations to what I had actually encountered on site.
I made several versions of the material: map with photographs, photographs only, annotations only, and annotations with photographs.
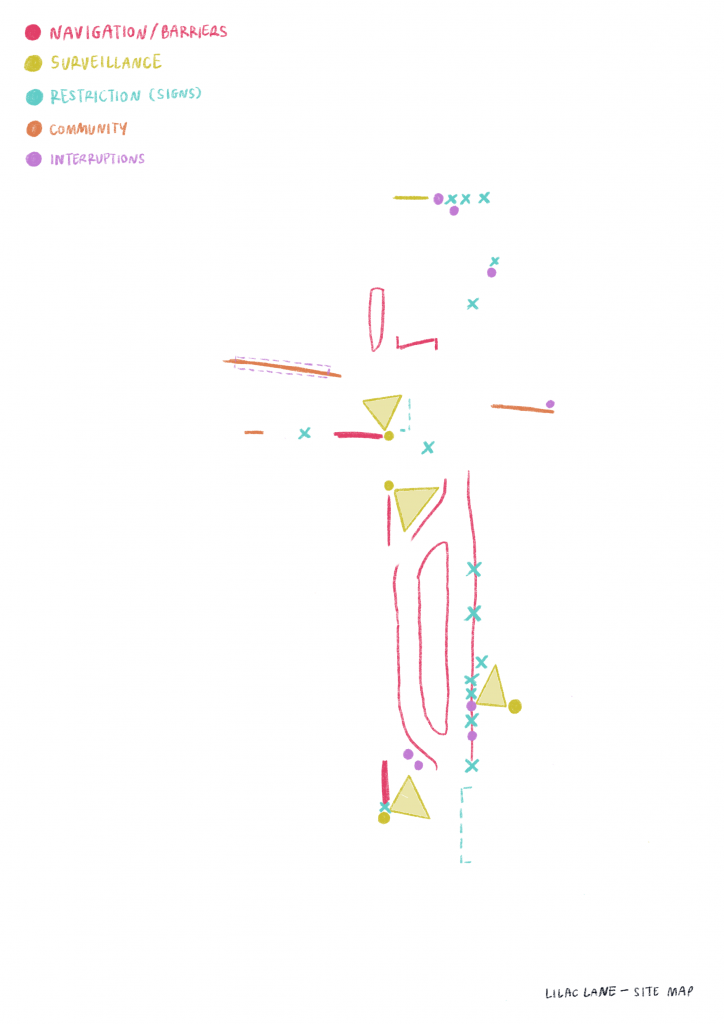
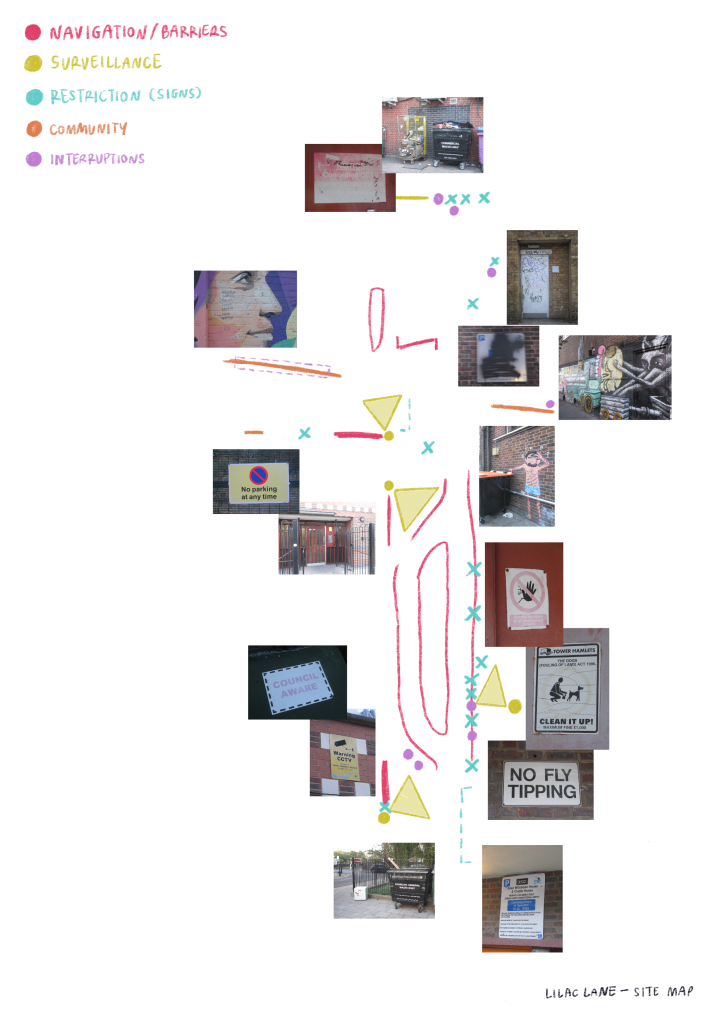
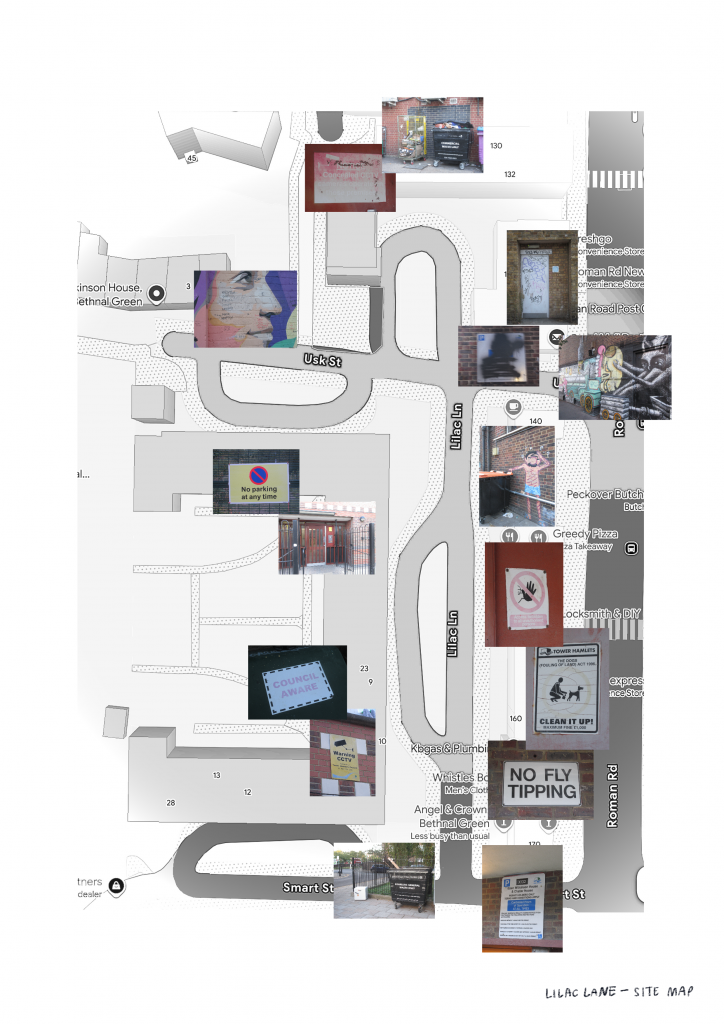
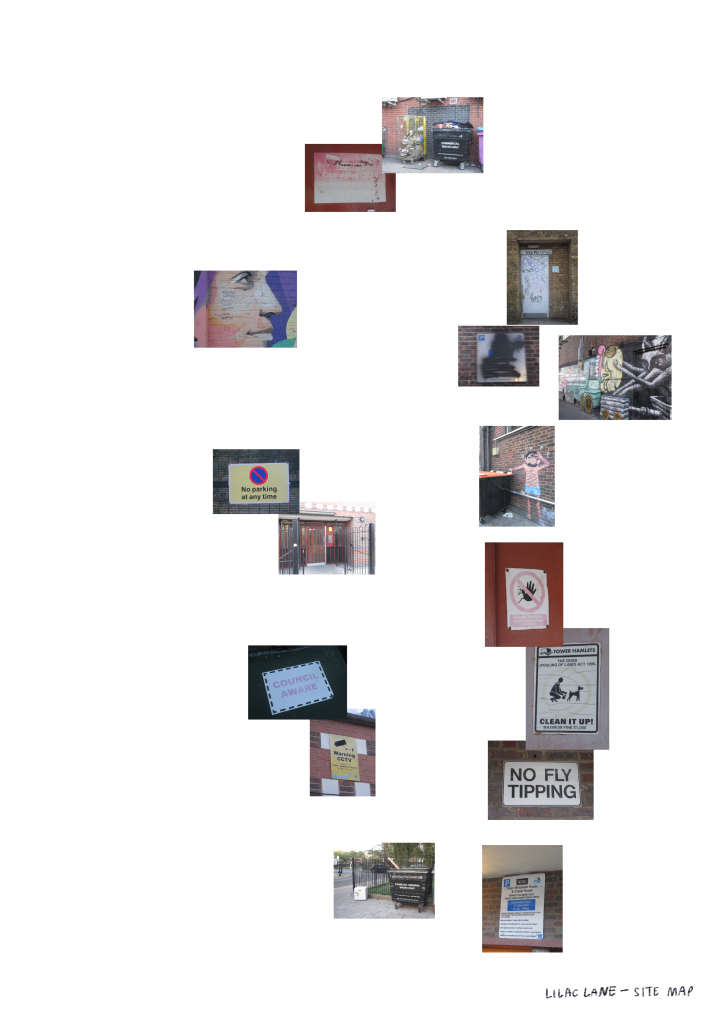
I also made two GIF versions (click hyperlink – I was unable to add to WordPress). In the first, the annotations remain as the background while images appear in the order I noticed them. In the second, the images appear in the same sequence but stay on the page, gradually building a map of my encounter with the estate.

Layering the map showed me that control is not communicated through signs alone. It is distributed across the organisation of routes, surveillance, restrictions, community-facing elements, and the interruptions introduced by people’s use of the space. The different versions also change what becomes visible: the map gives spatial context, the photographs foreground individual encounters, and the accumulating GIF makes the act of noticing part of the map itself.
The map is therefore not just a record of where things are. It becomes a way of comparing systems and asking how they operate together, while also recording the order in which I encountered them. I am interested in the overlap between designed systems and lived behaviour, rather than treating either as separate.
Fences appear as one of the estate’s clearest physical boundaries. What happens if I look closely at how different fences control access and visibility?
Leave a Reply